Understanding how to read a company’s balance sheet is one of the most important skills for anyone interested in investing, business analysis, or even managing their own small company. Many people get intimidated when they see rows of numbers, complex terminology, and financial jargon, but the truth is that a balance sheet is nothing more than a snapshot of a company’s financial health at a given point in time. Once you learn how to interpret it, you will be able to make better financial decisions, avoid risky investments, and spot profitable opportunities.
Before we dive into the details, let’s set the stage. Many investors often feel lost when they first encounter a company’s financial statements. That is exactly why this how to read a company balance sheet exists. It is designed to give you clarity, build your financial confidence, and help you make smarter investment decisions.
Why Balance Sheets Matter
A balance sheet is one of the three core financial statements, along with the income statement and cash flow statement. While the income statement shows profitability and the cash flow statement tracks liquidity, the balance sheet is like a financial X-ray. It shows what a company owns, what it owes, and the net value left for shareholders.
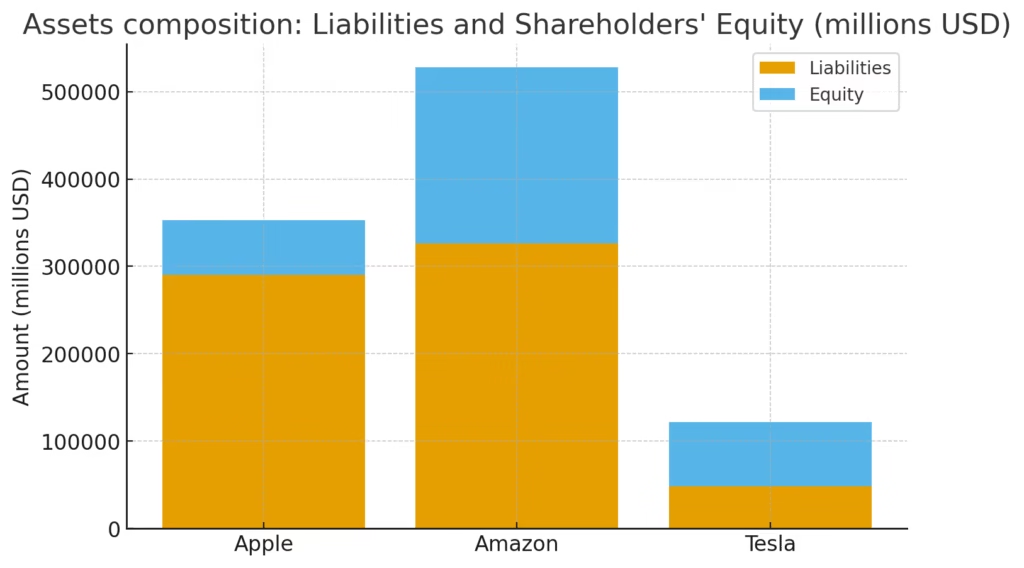
Imagine you are looking at Apple, Amazon, or Tesla. If you pull up their latest balance sheet, you will immediately see how much cash they hold, how much debt they carry, and the overall strength of their financial foundation. Investors in the US, UK, Canada, Australia, and Singapore rely on these insights to decide whether to buy, hold, or sell stock.
Quick question for you:
Think about a company you admire. If you opened its balance sheet right now, what would you look for first… cash, assets, or debt? Comment your answer below and let’s see how many people focus on the same metric.
The Structure of a Balance Sheet
A company’s balance sheet follows a very simple formula:
Assets = Liabilities + Shareholders’ Equity
This formula is at the heart of all accounting. Assets represent everything the company owns or controls. Liabilities show what the company owes to creditors. Shareholders equity reflects what is left for owners after debts are paid.
Let’s break it down in a way that anyone can relate to. Imagine your personal finances. If you own a house worth $300,000, a car worth $20,000, and have $10,000 in savings, your total assets are $330,000. If you also have a mortgage of $200,000 and a car loan of $10,000, your liabilities are $210,000. Subtract liabilities from assets and your equity is $120,000.
That same concept applies to companies, whether it’s a small retail shop or a tech giant like Microsoft.
Key Sections of a Balance Sheet
When you look at a balance sheet, you’ll usually see it divided into three major sections. Let’s explore them in detail.
1. Assets
Assets are everything a company owns or controls that has economic value. They are usually split into two categories:
- Current Assets: These are assets that can be converted into cash within one year, such as cash itself, accounts receivable, and inventory. For example, if a company sells laptops, the laptops sitting in its warehouse are inventory and are considered current assets.
- Non-Current Assets: These are long-term assets that provide value over many years, such as property, equipment, or patents. For example, Tesla’s gigafactories are non-current assets.
A healthy balance sheet shows a strong level of current assets compared to current liabilities. This is called liquidity and is a sign that the company can pay its short-term obligations without stress.
Quick Quiz for you:
If you were investing in a retail company, which current asset would you value more: cash on hand or inventory? Think about it and drop your answer in the comments.
2. Liabilities
Liabilities are obligations the company must settle in the future. These include loans, accounts payable, bonds, and other debts. Just like assets, they are split into:
- Current Liabilities: Debts due within one year, such as short-term loans or supplier invoices.
- Non-Current Liabilities: Long-term obligations like bonds, pensions, or multi-year loans.
A company with heavy debt might appear profitable in the short term, but an experienced investor knows to check the liability section before making a decision. For instance, when evaluating airlines during the pandemic, their massive debt loads were a red flag for many investors.
3. Shareholders’ Equity
This is the net value of the company after subtracting liabilities from assets. It represents ownership interest. For public companies, equity is the portion belonging to shareholders. Items like retained earnings and stock issuance appear here.
As an investor, this is the section that tells you how much of the company truly belongs to the owners and how much is borrowed.
Real Example: Apple Inc.
Let’s take Apple’s balance sheet as of 2023. Apple reported total assets of around $383 billion, liabilities of about $290 billion, and equity of roughly $93 billion. That means Apple is highly leveraged but still maintains one of the strongest financial positions in the world thanks to its massive cash reserves and brand value.
When you analyze a company like Apple, seeing that it holds nearly $60 billion in cash gives confidence to investors that it can weather downturns, invest in innovation, and return money to shareholders.
By now, you should have a clear understanding of what a balance sheet is and why it matters. We’ve covered the formula, explored assets, liabilities, and equity, and looked at a real-world example. we’ll go deeper into how to analyze these sections with ratios, metrics, and common red flags. We’ll also add practical tips so you can interpret balance sheets like a professional investor.

How to Analyze a Balance Sheet Like a Pro
we covered the basics of what a balance sheet is, why it matters, and the structure of assets, liabilities, and equity. Now, it is time to dig deeper and learn how to actually analyze those numbers. Knowing what the line items mean is good, but interpreting them correctly is what separates casual readers from serious investors and financial experts.
When you analyze a balance sheet, your goal is to answer three big questions:
- Is the company financially healthy right now?
- Can it grow sustainably without running into financial trouble?
- Is the company’s value supported by its assets and not just hype?
Let’s go step by step.
Liquidity Ratios
One of the first things professionals check in a balance sheet is liquidity. Liquidity refers to how easily a company can pay its short-term obligations.
Two important ratios to know are:
Current Ratio = Current Assets ÷ Current Liabilities
- A ratio above 1 means the company has more short-term assets than short-term debts, which is generally healthy.
- Example: If a company has $50 million in current assets and $25 million in current liabilities, its current ratio is 2. That means it can easily pay off its debts.
Quick Ratio = (Current Assets – Inventory) ÷ Current Liabilities
- This is a stricter test because it removes inventory, which might take time to sell.
- Example: If the same company has $20 million in inventory, its quick ratio is (50 – 20) ÷ 25 = 1.2. Still healthy, but less comfortable than the current ratio suggested.
quiz moment:
If you were analyzing a tech company, would you rely more on the current ratio or quick ratio? Share your thoughts in the comments.
Debt Analysis
Debt can either be a growth tool or a burden. On a balance sheet, you want to check both short-term and long-term liabilities. Too much debt compared to equity is a warning sign.
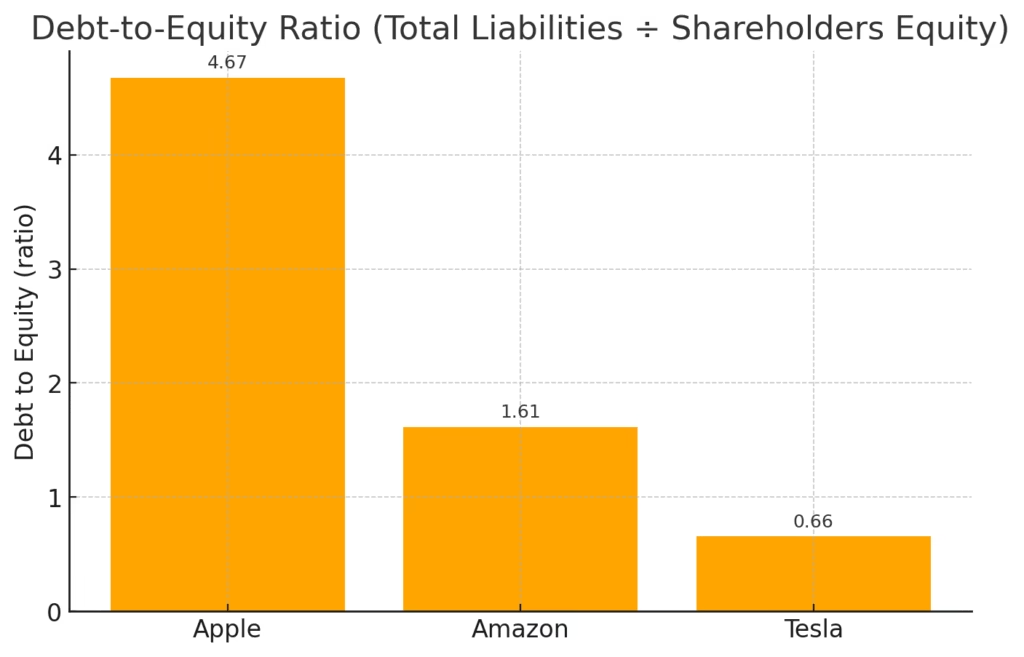
Debt-to-Equity Ratio = Total Liabilities ÷ Shareholders’ Equity
- A ratio below 1 usually means a company is financing itself more with equity than debt, which is safer.
- Example: If a company has $300 million in liabilities and $200 million in equity, the debt-to-equity ratio is 1.5. That is considered high risk.
During the 2008 financial crisis, many companies that collapsed had extremely high debt-to-equity ratios. This shows why looking beyond profits to the balance sheet is crucial.

Efficiency Ratios
Efficiency ratios tell you how effectively a company uses its assets.
- Asset Turnover Ratio = Net Sales ÷ Average Total Assets
A high ratio means the company is generating strong sales from its assets. - Example: A retail company with $200 million in sales and $100 million in assets has an asset turnover of 2. This suggests it is highly efficient.
- Inventory Turnover Ratio = Cost of Goods Sold ÷ Average Inventory
A high turnover means products are selling quickly. A low turnover may mean unsold stock is piling up.
Think of companies like Walmart or Costco. Their inventory turnover ratios are much higher than luxury retailers because their business model is built on moving products quickly.
Red Flags to Watch Out For
Balance sheets can reveal hidden risks if you know what to look for. Here are some common red flags:
- Excessive short-term debt: If current liabilities are consistently higher than current assets, the company might face liquidity issues.
- Shrinking equity: If shareholders equity decreases year after year, it might suggest declining profits or poor financial management.
- Intangible assets making up most of total assets: Some companies inflate their asset value with goodwill or intellectual property. While these can be valuable, they are harder to measure compared to cash or property.
Real-world case: WeWork before its IPO in 2019 looked impressive on the surface. But its balance sheet showed massive liabilities and questionable intangible assets. Investors who checked the balance sheet early spotted the risks before the hype collapsed.
Practical Exercise for You: how to read a company balance sheet
Let’s do a simple exercise. Imagine a company reports:
- Current Assets: $120,000
- Current Liabilities: $60,000
- Total Assets: $500,000
- Total Liabilities: $300,000
- Equity: $200,000
- Net Sales: $400,000
Question 1: What is the current ratio?
Question 2: What is the debt-to-equity ratio?
Drop your answers in the comments. If you calculate them correctly, you are already reading a balance sheet like an investor.
The Role of Trends Over Time
One mistake beginners make is looking at a single balance sheet in isolation. The real power of analysis comes from tracking changes over time.
For example, if you look at Amazon’s balance sheet today, you might see a strong cash position. But what matters is whether Amazon has been consistently building cash or if it has dipped into reserves during slowdowns.
If liabilities are growing faster than assets year after year, it signals trouble. On the other hand, steady equity growth is a sign of financial strength.
Internal and External References
If you want to practice reading real balance sheets, you can check public companies’ annual reports on the SEC EDGAR database (United States). This is a free resource where all listed companies file their financial statements. For learning step-by-step fundamentals, Investopedia’s balance sheet guide is another helpful external reference.
At the same time, our own website Stock and Insurance is building educational tools and stock analysis resources designed to simplify financial concepts for beginners and advanced readers alike. Stay tuned by subscribing to our newsletter for updates.
By now, you know how to use ratios to analyze liquidity, debt, and efficiency, plus how to spot red flags and think about trends over time. You also practiced calculations with real examples.
Now, we will tie everything together with detailed case studies, step-by-step walkthroughs, and answers to frequently asked questions from new investors. We will also cover how beginners can use balance sheet insights in their first investments.
Applying Balance Sheet Analysis to Real Companies
It is one thing to learn ratios and formulas. It is another thing to apply them in the real world. To make this guide more practical, let’s walk through a balance sheet case study.
Imagine you are looking at Apple’s financial statements. As of its last annual report, Apple reported:
- Total Assets: over $350 billion
- Total Liabilities: around $280 billion
- Equity: approximately $70 billion
At first glance, that is a strong balance sheet. Apple has more assets than liabilities and generates massive cash flows from its products and services.
Now compare this to a struggling company, say a retail chain losing market share. If that company shows $10 billion in assets but $9 billion in liabilities, the margin of safety is razor thin. One bad quarter could push it into financial trouble.
This is why balance sheet analysis is not just theory. It is a real-world filter that separates strong companies from weak ones.
Case Study: A Startup Example
Balance sheets are also crucial for evaluating startups. Suppose you are investing in a new fintech company. Their balance sheet shows:
- Current Assets: $2 million
- Current Liabilities: $3 million
- Equity: negative $500,000
This means the startup owes more than it owns. While it might have growth potential, from a financial health perspective, it is already in risky territory.
An experienced investor would ask: does the company have enough runway to survive until it becomes profitable? Or will it need constant funding rounds?
Balance sheets force you to ask these hard questions before investing.
Common Mistakes Beginners Make
- Focusing only on profit and loss statements: A company might look profitable in the short term but be drowning in debt. Always cross-check with the balance sheet.
- Ignoring long-term liabilities: Student loan companies, airlines, and telecoms often carry massive long-term debt. Without understanding the repayment structure, you might underestimate risk.
- Not considering industry norms: Some industries naturally carry more debt than others. For example, utility companies often have high debt ratios but are considered stable because of predictable cash flows.
- Looking at one year only: A single balance sheet is just a snapshot. Always compare multiple years to understand trends.
Frequently Asked Questions
Q1: Can small investors really use balance sheets, or is this just for professionals?
Absolutely, small investors can and should use balance sheets. Even if you are buying just a few shares, you are still putting your money at risk. Understanding the company’s financial health gives you an edge over casual traders.
Q2: What is the easiest thing to check first in a balance sheet?
Start with current assets and current liabilities. This gives you a quick sense of whether the company can handle its short-term debts.
Q3: Should I be worried if a company has a lot of intangible assets?
Not necessarily. For tech companies, patents and software are valuable. But if intangibles make up more than half of total assets, dig deeper. Ask yourself if those assets can be realistically turned into cash if needed.
Q4: How often are balance sheets updated?
Public companies update them quarterly and annually. Private companies may update them less frequently, depending on their internal practices.
Q5: Can artificial intelligence help analyze balance sheets?
Yes, modern tools and AI platforms are increasingly helping investors spot patterns and risks in financial statements. But AI should complement, not replace, human judgment.
A Quick Challenge
Here’s a fun exercise. You are analyzing two companies:
Company A
- Current Assets: $80,000
- Current Liabilities: $40,000
- Equity: $100,000
- Total Liabilities: $60,000
Company B
- Current Assets: $50,000
- Current Liabilities: $60,000
- Equity: $30,000
- Total Liabilities: $70,000
Question: Which company looks financially healthier and why? Drop your answer in the comments below. We will discuss the solution in future posts.
How to Use Balance Sheet Insights in Your Investment Decisions
Understanding a balance sheet is not just about crunching numbers. It is about applying insights to real choices:
- If you are a long-term investor, you want companies with strong equity growth, manageable debt, and healthy liquidity.
- If you are a value investor, you look for companies trading below their book value but still showing solid assets.
- If you are a trader, balance sheet trends help you avoid companies at risk of sudden collapse.
Warren Buffett once said he does not invest in companies he cannot understand. The balance sheet is the first test of that philosophy. If the numbers do not make sense to you, it is safer to walk away.
Why This Matters for Global Investors
Since this blog targets readers in the US, UK, Canada, Singapore, and Australia, let’s note a key detail. While accounting standards differ slightly across countries, the principles of a balance sheet remain the same. Assets must equal liabilities plus equity everywhere.
For example, companies in the US follow GAAP (Generally Accepted Accounting Principles), while those in most other Tier 1 countries follow IFRS (International Financial Reporting Standards). As an investor, you should be aware of these differences, but the big picture remains consistent.
My Final Thoughts
By now, you have walked through the full step-by-step guide to reading a company’s balance sheet. You started with the basics and then learned how to apply ratios and spot risks, and finished with case studies, FAQs, and practical applications.
Reading a balance sheet is not about memorizing formulas. It is about developing financial literacy that empowers you to make smarter investment decisions. The more balance sheets you review, the sharper your instincts will become.
Next time you look at a company you admire, do not just read the headlines or watch the stock price. Open the balance sheet. The truth about its financial health is right there, waiting for you to discover.


