
Investors searching for clarity in 2026 often look backward before they look forward. The US stock market history is a long record of innovation, panic, recovery, and long term wealth creation. Understanding the history of the US stock market gives a visitor context that charts alone cannot offer. The past is not a perfect predictor, yet it holds fingerprints that help investors make informed decisions today.
This blog delivers an experience that blends expert analysis, storytelling, real data, and practical lessons that prepare you for the next decade of investing. The writing style mirrors how a seasoned financial analyst would explain complex market cycles to a friend over coffee. Clear examples. Real historical numbers. Psychological insights. And most importantly, investment lessons for 2026 that help you stay grounded during market noise.
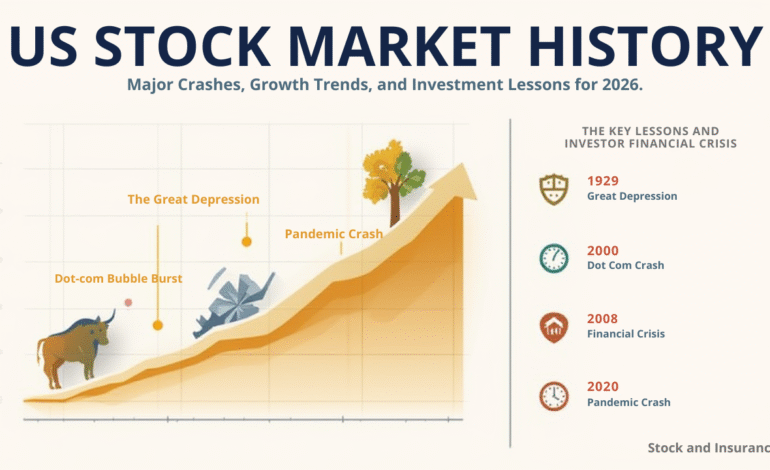
US Stock Market History and Why It Matters for 2026
The US stock market history is a living archive of human behavior. Every rally has traces of optimism. Every crash has echoes of fear. The unique part is that despite wars, recessions, inflation shocks, policy mistakes, technology shifts, and global crises, the market has grown significantly over the last century.
To show this more clearly, consider the S&P 500. Its long term growth trend makes one thing unmistakable. Volatility is temporary. Growth is structural. For those who want to explore official long term data on interest rates, recessions, and economic cycles, the Federal Reserve’s database at FRED provides publicly available charts and historical records that deepen this analysis.
Here is a simple table that illustrates how the S&P 500 evolved over time.
| Year | Approx S&P 500 Level | Historical Context |
|---|---|---|
| 1926 | 12.65 | Pre Great Depression industrial era |
| 1950 | 19.45 | Post war recovery |
| 1980 | 110.9 | Inflation shock recovery |
| 2000 | 1425 | Dot com boom |
| 2020 | 3230 | Pre pandemic stage |
| 2024 | Above 5000 | AI driven rally and economic resilience |
Even when a visitor sees huge crashes on the chart, the trajectory over decades is upward. This is the core lesson. Storms come. Storms go. Long term progress remains.

If you are new to investing and want to build a strong foundation before diving deeper into market cycles, you can also explore my detailed guide on What is Stock Market: The Ultimate Beginner’s Guide in 2026. It pairs perfectly with this history based overview and helps you understand how the market works today.
Major Market Crashes That Changed the United States Economy
Every generation experiences at least one crisis that shapes investor psychology. That is why studying the history of the US stock market is essential for modern risk management.
Below are the most influential crashes, explained in clear terms without technical confusion. The National Bureau of Economic Research also maintains official recession dating and research papers that help explain the economic backdrop behind major market crashes and recovery periods.
The Crash of 1929: The Beginning of the Great Depression
Imagine the US economy in the late 1920s. Radio. Newspapers. Car manufacturing. Infrastructure. Optimism was abundant and margin trading was common. People borrowed heavily to buy stocks.
On an October morning in 1929, selling pressure rose without any major news. Within the next few weeks, panic selling consumed the market. The Dow fell about 89% from its September 1929 peak to its July 1932 low.
Investment lesson for 2026:
Overconfidence is a powerful threat. When asset prices rise too fast without earnings growth, caution becomes a form of intelligence.
Black Monday 1987: The Fastest One Day Collapse
On October 19, 1987, the Dow plunged more than 22 percent in a single day. No single reason caused it. Programmatic trading, rising interest rates, and market psychology all played a part.
This had a positive aftermath. Regulators introduced circuit breakers to avoid emotional mass selling.
Investment lesson:
Technology can speed up both errors and efficiency. Diversification provides insulation against unexpected shocks.
Dot Com Crash 2000: The Price of Innovation FOMO
During the late 1990s, companies with little revenue raised millions. Websites with no business models went public at huge valuations. When reality returned, the Nasdaq Composite lost nearly 78 percent from its peak.
Lesson:
Innovation is powerful. Overvaluation is dangerous. 2026 investors must balance curiosity with discipline especially in AI, biotech, robotics, and crypto ecosystems.
2008 Global Financial Crisis: The Great Deleveraging
This was not just a market crash. It was a structural breakdown of the global credit system. Mortgage backed securities failed. Banks collapsed. Consumer confidence dropped.
The S&P 500 fell more than 57 percent from its 2007 high.
Lesson:
Liquidity is oxygen for markets. Economic health relies on trust, credit availability, and transparent regulation.

Growth Trends That Define the History of the US Stock Market
Market crashes may attract more attention, but growth trends define long term wealth.
Trend 1. Consistent Innovation Drives Long Term Market Value
Innovation in America has never moved in a straight line, but it has never stopped. The stock market has rewarded:
Digital technology
Healthcare breakthroughs
Energy transitions
Consumer brands
AI and automation
Large scale infrastructure
Each wave of innovation creates new leaders. The Fortune 500 list in 1970 looks nothing like 2024. This is a signal to 2026 investors. The winners of tomorrow may be companies that do not even exist today.
Trend 2. Demographics and Consumer Demand Shape Market Growth
The US population has consistently expanded and consumption remains strong. Even during recessions, essential spending continues. Stable demand creates stable corporate earnings which become the backbone of the stock market.
Trend 3. Monetary Policy Influences Market Direction
The Federal Reserve plays a major role in short term cycles. Interest rates decide borrowing costs, housing activity, corporate expansion, and valuations. Understanding Federal Reserve policy helps investors anticipate market transitions.
For example:
Low rates help growth stocks.
High rates strengthen value and dividend stocks.
Trend 4. Long Term Returns Are Built on Compounding
Even simple investments grow dramatically through compounding. An investment of 1000 dollars in the S&P 500 in 1990 would be worth more than 20000 dollars today, excluding dividends.
This is the quiet strength behind the American market. Time rewards patience.
If you are interested in how the next wave of companies might shape future market cycles, you may also like my analysis on Upcoming IPOs 2026: Top IPOs to Watch and Global Trends. It highlights new businesses and sectors that could influence the next decade of US market growth.
Test Your Market Knowledge
Which market fall was the steepest between 1929 and 2008
A. The Great Depression
B. Dot Com Crash
C. Financial Crisis
Answer: The Great Depression, because the Dow lost nearly 90 percent from the peak.
Which factor contributed most to the 1987 crash
A. Interest rate hikes
B. Program trading
C. Overvaluation
Answer: Program trading amplified selling pressure, although multiple factors combined.
The journey through the US stock market history becomes even more fascinating when you shift from looking at crashes to understanding how the market rebuilds itself each time. The patterns of recovery, the strength of corporate earnings, and the resilience of long term investors offer powerful lessons for 2026.
How the Market Recovers After Crashes
People often ask a simple question. Why does the market always bounce back Eventually it comes down to productivity growth, innovation cycles, corporate reinvention, and policy support.
Recovery after the Great Depression
The Great Depression was devastating, yet it set the stage for major industrial expansion. New Deal programs increased employment. Manufacturing evolved. New industries were born.
Between 1932 and 1937, the Dow nearly quadrupled. That is a reminder that historic declines can breed historic opportunities.
Recovery after the Dot Com Crash
Many websites from the 1990s disappeared, yet the internet itself became stronger. Out of that rubble emerged global giants like Amazon, Google, Salesforce, and eventually the cloud infrastructure that drives AI today.
When investors revisit the history of the US stock market, they see that technological transitions often begin in chaos.
Recovery after the 2008 Crisis
Governments injected liquidity. Central banks slashed interest rates. The United States rebuilt the housing system and strengthened banking regulations.
The S&P 500 rose more than 300 percent from its 2009 lows during the next decade. The 2008 crisis became a launchpad for one of the longest bull markets in history.
For readers who want to translate historical lessons into practical ideas, I have also covered Top Stock Market Ideas to Watch Before 2026. It breaks down emerging investment trends and insights that can help you position your portfolio for the next market cycle.
Investment Lessons for 2026 from More Than 100 Years of Market Data
Understanding the history of the US stock market gives investors a toolkit that works regardless of political changes, technological shifts, or global tensions.
Lesson 1. Volatility is Normal and Not a Red Flag
The average correction in US markets is around 13 percent every year.
Bear markets occur roughly every 5 to 6 years.
Yet the long term trend remains positive.
This is one of the most underrated truths in investing. A visitor who understands this becomes less emotional during news cycles.
Lesson 2. Timing the Market is Less Effective than Time in the Market
Historically, since 1926, every 15-year rolling period of the S&P 500 has delivered a positive nominal return.
Even missing the ten best performing days in a decade can cut total returns by more than 40 percent.
In 2026, investors should prioritize consistency over prediction.
Since this article highlights how major crashes have shaped investor behavior, it is equally important to evaluate your own portfolio for weak spots. I have a practical guide on this topic titled Is Your Portfolio Ready for a Crash? Here’s What to Fix, which helps you assess risks and strengthen your strategy before the next downturn.
Lesson 3. Innovation Always Creates New Leaders
Think about these transitions:
General Electric and radio dominated the early 1900s.
Automobiles and oil shaped the mid century era.
Computers and semiconductors took over in the 1980s.
Internet companies reshaped the 2000s.
AI and cloud systems lead the 2020s.
This tells modern investors one clear thing. Avoid anchoring your portfolio to past winners only. Look for companies positioned for the next technology wave.
Lesson 4. Risk Management Is a Lifelong Habit
The crashes of 1929, 1987, 2000, and 2008 all share similar traits.
Too much leverage.
Excessive speculation.
Rapid valuation increases.
Prudent investors diversify, maintain emergency cash, and avoid chasing hype.
Lesson 5. Compounding Rewards Long Term Discipline
The mathematics of compounding is almost magical.
An investor who began with 5000 dollars and added 100 dollars monthly into an S&P index fund starting in 1980 would have more than 450000 dollars today.
Even small amounts grow exponentially when given enough time.
Lesson 6. Stay Aware of Federal Reserve Cycles
Interest rates influence every asset class.
Bonds.
Growth stocks.
Value stocks.
Real estate.
When rates rise, companies with high debt suffer.
When rates fall, growth accelerates.
Knowing the basic direction of monetary policy helps frame expectations for 2026.
Case Study Examples to Help You Understand Market Cycles
Case Study 1. The Patient Investor
Imagine an investor named Daniel who invested one thousand dollars each year starting in 1990 into the S&P 500. He stayed invested through the Dot Com crash, the financial crisis, and the pandemic.
By 2024, Daniel would have accumulated more than one hundred thousand dollars, mostly due to compounding.
This highlights that ordinary people who invest early often outperform traders who jump in and out.
Case Study 2. The Emotional Investor
Another investor, Sarah, invested heavily during market highs. She panicked and sold during downturns. Over a twenty year period, her overall return was nearly half of Daniel’s.
This real world example appears repeatedly across financial studies conducted by Dalbar and Fidelity.
The conclusion is simple. Emotional decision making destroys long term wealth.

Top 5 Largest Market Falls and Time to Recover
| Event | Maximum Decline | Years to Full Recovery |
|---|---|---|
| Great Depression 1929 | About 89 percent | About 25 years |
| Dot Com Crash 2000 | About 78 percent | About 15 years |
| 2008 Financial Crisis | About 57 percent | About 4 years |
| 1973 Oil Crisis | About 48 percent | About 7 years |
| 2020 Pandemic Crash | About 34 percent | Less than 1 year |
This table helps how unpredictable short term market cycles can be while still seeing the resilience of long term performance.

Quick Quiz
Which recovery was the fastest
A. 2008 crisis
B. 2020 pandemic
C. Dot Com crash
Answer: The 2020 pandemic recovery was the fastest because fiscal stimulus and rapid digital adoption boosted corporate profits.
Which major lesson applies most to 2026
A. Ignore volatility and focus on discipline
B. Sell whenever the news looks scary
C. Invest only in one sector
Answer: The correct answer is to ignore volatility and remain disciplined. Long term results reward consistency, not fear driven decisions.
The story of the American stock market is a story of resilience. You have already explored its major crashes, long term recovery patterns, and powerful investment lessons.
A Framework to Understand the Market in 2026
Most people often ask how to use historical insights in a modern world filled with technological disruption. The answer is to combine economic signals, corporate fundamentals, and human behavior. History does not repeat in an identical way, but it rhythmically echoes patterns.
Here is a clear framework that blends these elements.
1. Understand the Economic Cycle
Every economy rotates through four stages:
Expansion
Peak
Contraction
Recovery
In expansion, corporate profits grow and markets strengthen.
In contraction, layoffs rise and consumer spending slows.
Recognizing the stage helps investors choose the right assets.
For example, in 2026 if interest rates are declining, growth stocks often regain leadership. If inflation remains sticky, value stocks and dividend payers tend to outperform.
2. Watch Corporate Earnings Not Headlines
News cycles change every hour. Corporate earnings change every quarter. Long term market direction follows earnings, not emotions.
During the last century, periods with strong earnings growth consistently delivered higher returns.
Visitors should focus more on company balance sheets than on social media predictions.
3. Follow Monetary Policy Trends
The Federal Reserve influences:
Loan availability
Stock valuations
Bond yields
Housing demand
When rates rise, borrowing becomes expensive. When rates fall, markets tend to rise.
A helpful strategy is to track Federal Reserve announcements and economic indicators such as inflation, unemployment, and GDP.
4. Respect Market Psychology
Markets move through cycles of fear and greed. These cycles are often stronger than economic fundamentals.
This is why long term investors use rules such as:
Avoid panic selling
Maintain allocation discipline
Use dollar cost averaging
This mindset helps protect wealth during stressful periods.

Behavioral Finance Lessons That Strengthen Investor Mindset
The history of the US stock market shows that human behavior influences returns just as much as math and data. Becoming aware of these patterns gives an investor a major advantage.
Recency Bias
People often assume that recent trends will continue.
During the Dot Com era, investors believed tech stocks would rise forever.
During the 2008 crisis, many believed markets would not recover for decades.
The result was poor timing and poor outcomes.
Loss Aversion
Investors fear losing money more than they enjoy making it.
This creates emotional decisions.
A visitor who becomes aware of this bias can avoid selling during temporary declines.
Herd Behavior
When many investors move in one direction, people tend to follow even without analysis.
This contributed to the 1929 bubble, the Dot Com bubble, and crypto volatility.
Strong investors learn to analyze independently.
Practical Portfolio Strategies for 2026 Based on Historical Insights
Here is a practical way to apply the insights from the last century of market data.
1. Build a Diversified Core Portfolio
A balanced mix of US equities, international equities, government bonds, and alternative assets helps reduce risk while capturing growth.
Historical data shows that diversified portfolios recover faster from downturns.
2. Use Dollar Cost Averaging Consistently
By investing a fixed amount regularly, you avoid emotional timing errors. This method worked for investors through every major crash in history.
3. Tilt Toward Innovation Without Overexposure
Innovation drives long term wealth.
However, the Dot Com crash proves that excitement without fundamentals is risky.
In 2026, investors should research earnings stability, cash flow, and competitive advantage before investing in AI, robotics, or biotech startups.
4. Keep a Long Term Time Horizon
Every major market decline eventually became insignificant on a long term chart.
The worst outcomes historically belong to investors who sold during panic periods.
The best results belong to investors who stayed invested during difficult times.
Prediction Principles for 2026 Without Making Unrealistic Forecasts
Predicting exact market movements is impossible and even misleading, but preparing for different possibilities is smart. Below is a grounded approach.
Scenario 1. Soft Landing and Rate Cuts
If inflation stabilizes and the Federal Reserve begins easing policy, growth stocks and technology leaders may outperform. Corporate earnings could rise as borrowing becomes cheaper.
Scenario 2. Inflation Remains Sticky
If inflation stays elevated, sectors like energy, utilities, essential consumer goods, and dividend payers could perform better.
Scenario 3. Slower Global Economic Growth
Investors may lean toward defensive sectors such as healthcare and established large cap companies that generate steady profits.
These are not predictions. They are frameworks that help investors build balanced, resilient portfolios.
Quiz
Which investor mindset leads to better long term results
A. Checking the portfolio every hour
B. Staying invested through cycles
C. Selling whenever markets fall
Answer: The correct answer is staying invested. Checking too often increases emotional decisions. Consistency wins over time.
Which factor influences markets the longest
A. Short term news
B. Central bank policy
C. Corporate earnings
Answer: Corporate earnings determine long term value. News headlines create temporary noise.
Conclusion: What US Stock Market History Teaches Us About the Future
The US stock market history is not just a collection of old stories. It is a blueprint for building wealth in the modern world. From the Great Depression to the Dot Com bubble to the 2008 crisis to the pandemic, the market has recovered stronger every time. Technology evolves. Human behavior repeats. Innovation accelerates. And long term investors benefit the most.
When readers look toward 2026, history gives them clarity. Volatility is expected. Growth is structural. Innovation is continuous. Patience is rewarded. The journey requires discipline, research, and a willingness to ignore the noise that surrounds the market every day.
Those who understand how the past shaped today can make smarter choices for tomorrow. The lessons in this blog will help you invest with confidence instead of fear.

